

COVID-19 is having unprecedented effects on the global economy as millions of people worldwide practice social distancing to stop the spread of the virus. One result is that companies, not only within the financial industry, have started experiencing or anticipating potentially significant liquidity challenges. For this reason, multiple firms have started issuing guidance to help companies manage their global cash and liquidity positions during these times of high uncertainty. This is the time to test all cash flows, stress test the downsides, and model what-if analyses and worst-case scenarios.
Regulators globally are not new to liquidity assessments. The European Securities and Markets Authority’s (ESMA) guidelines from September 2019 are among the latest issued that are aimed to introduce minimum standards for liquidity stress testing across alternative investment funds (AIFs) and UCITS. The EU Regulator also echoes the US Securities and Exchange Commission’s initiative introduced a few months earlier, by going one step further compared to the original requirements introduced by the second Markets in Financial Instruments Directive (MiFID II) and Money Market Fund Regulation (MMF). In fact, regulators have now mandated a new set of rules aimed at quantifying liquidity risk in a more structured and standardised way across both assets and liabilities.
A scenario-based approach
It is important to note how the behaviour of the markets around COVID-19 has been extraordinary. In just one month, the volatility of corporate bonds has more than doubled together with the credit spreads levels. Given the inevitable global economic slowdown caused by the virus, large amounts of US investment-grade corporate bonds are now facing a considerably higher risk of a downgrade.
This is a clear symptom of a deterioration in credit quality, in some cases explained by the increasing lack of liquidity in the bond market, amplified by even more private-equity transactions. The greater the movement down to junk status, the higher the risk of a waterfall of funding dislocations that make everything worse, both financially and economically.
Bid/ask spreads usually capture such movements. Especially for fixed income securities, transaction costs are implicit in bid/ask spreads quoted by intermediaries and low liquidity in the fixed income markets usually implies wide bid/ask spreads.
When measuring market liquidity risk, the traditional problem is that the data needed for calibrating the models is only available for liquid instruments, trading on a regular basis and for which books of bid/ask and volumes are available.
For this reason, the current approaches to measuring liquidity risk fail to provide any indication for the most opaque and illiquid instruments, which is where the measurement of liquidity risk is needed most.
Back in 2010, we introduced an approach based on liquidity scenarios within our Revolution platform, which is universal because it covers potentially any financial asset, from equities to bonds, from complex certificates to OTC derivatives, all under a homogeneous and consistent approach.
Revolution offers three different liquidity scenarios:
Normal scenario: Reproduces the usual market conditions of liquidity, taking as a reference the variations in drivers registered in unstressed markets
Stressed scenario: Pictures stressed conditions of liquidity and uses as a reference the first six months of 2008
Highly stressed scenario: Depicts the highest moment of liquidity stress between September 2008 and March 2009
Each scenario is divided into five different components. The most important component re-builds, with a quantitative approach based on observed market data (credit spreads, interest and inflation rates, foreign exchange rates, equities, etc.), the fair value bid and asks of all the financial instruments that can be priced via an arbitrage-free pricing function, providing a solid and consistent benchmark of liquidity risk. In other words, the engine replicates the algorithms used by market makers in creating prices and links the “cash” markets to the derivative markets, providing a unified and consistent framework for both worlds.
The fair bid/ask value takes into consideration many risk dimensions, including maturity, currency, exposure to different underlying risk drivers, etc. However, the cost of liquidation may also be driven by the asset class. Obvious examples are asset-backed securities: although their risk factors are similar to those of a plain bond, during the credit crisis these instruments had a significant liquidity risk premium. This does not apply to payoffs with low complexity such as zero coupon or straight bonds, nor to futures or swaps characterised by the management of margins. In fact, when a swap is involved, the security in account acts as collateral against the credit exposure and the collateral at the counterparty institution has secured liquidity by definition.
Within the fixed income space, one additional essential measure of liquidity for a bond is the size of the bond nominal outstanding: a 50 million issue will certainly be less liquid than a five billion issue.
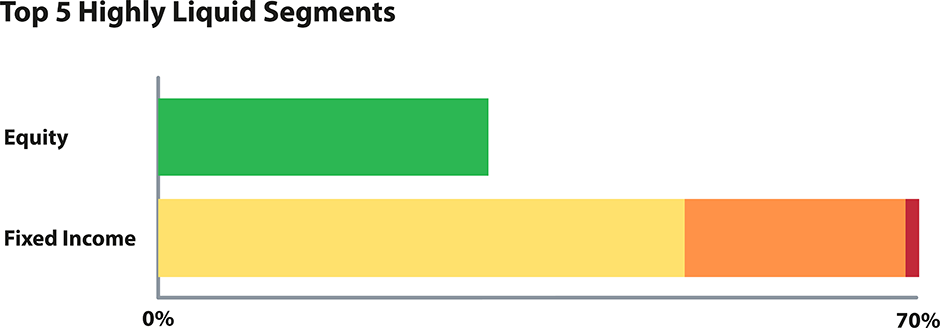
The charts below represent the increasing liquidity risk over the latest couple of years for a balanced model portfolio diversely invested in emerging equities, government- and high-yield corporate bonds. The cost of liquidation in highly stressed market conditions has moved upward from 0.50 percent to 1.50 percent, mostly driven by bid/ask and bond nominal outstanding. click to expand
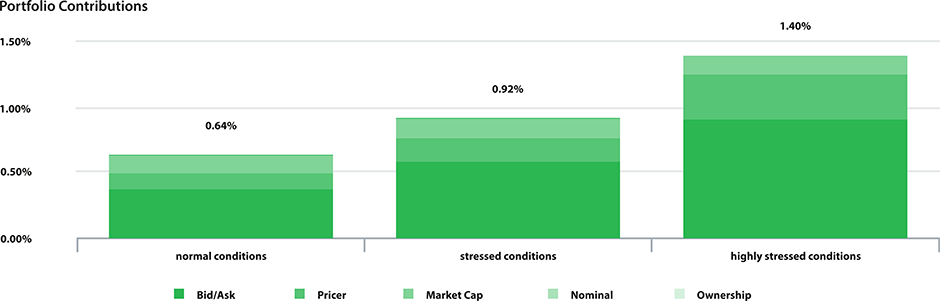

COVID-19 has stressed the need to simulate the impact on liquidity by looking at the different magnitude of shocks. The liquidity cost of bonds in previous crises was lower compared to today, as we were still in the presence of investment banks with decent desks and capital allocated to them. Now, this is not the case. Even the 2008/2009 crisis has not been as significant as in 2020 in terms of market drops.
For this reason, we recently introduced a new hybrid scenario-based approach to help solve this problem. This consists of an admixture of the above described liquidity risk figures and the results of selected shocks applied to the bid/ask component (either historical events or single/multi factor driven).
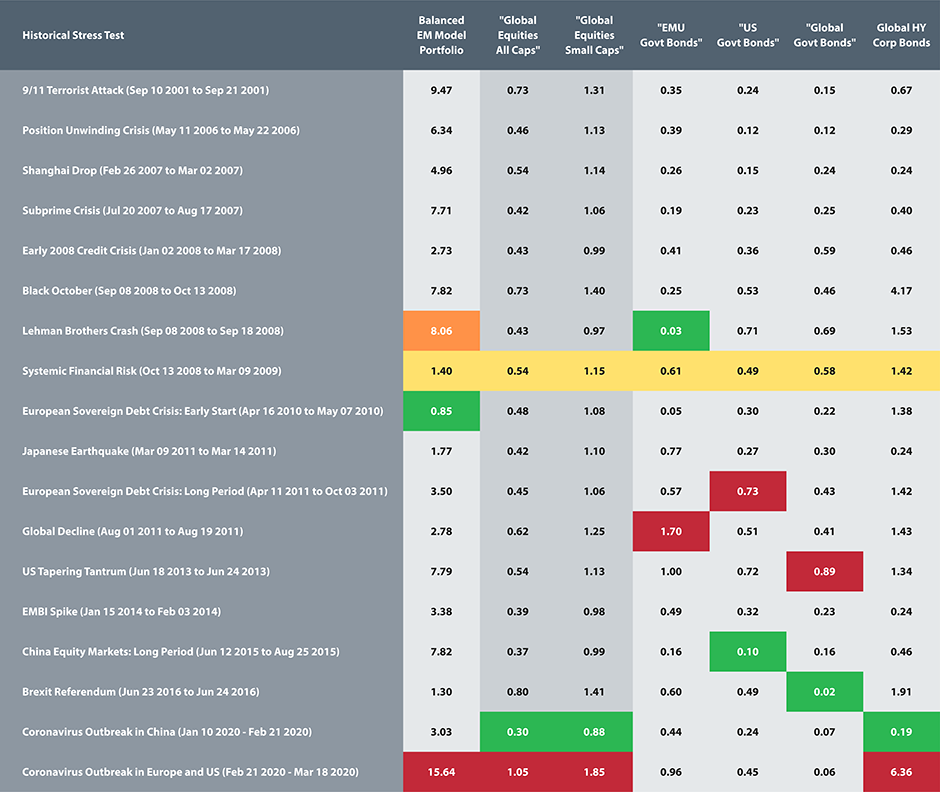
The below table summarises a number of historical events over the last two decades and highlights how COVID-19, shown in the last row in the red boxes, goes beyond any previous occurrence, almost doubling the costs registered in correspondence of Lehman Brothers Crash and Black October in 2008, represented in the orange box, not only for the sample balanced portfolio described above but across a number of asset classes, from equities to corporate bonds. click to expand
It’s always a matter of time
The different financial crises in recent times have demonstrated that under fairly unpredictable circumstances the liquidity of traded instruments can nearly vanish. The lack of liquidity combined with the nature of modern derivatives led to massive fund redemptions, which consequently increased the pressure to sell into thin markets. The result? A rapidly downward spiralling cycle of collapsing prices. Accordingly, regulators worldwide have developed new rules that require fund managers to measure and report on the actual liquidity of the instruments in their portfolios and the length of time it might take to sell them.
As traders know, selling a large position quickly can impact its price – the more of something one has to sell and the less interest there is in it, the more the price will have to move in order to trade (slippage in industry terms). There is always some liquidity: it’s nearly always possible to get out of a position, it’s more a question of how long it will take and/or how much it will cost. The relationship between volume and cost is certainly not linear: tripling the amount on offer does not triple the impact on the price.
Revolution allows different approaches in this space: from the use of volumes and open interests to the use of liquidity scores, from the application of liquidity risk mapping to the hierarchical application of any of these approaches in combination with custom overrides.
The monitoring of time to liquidate, over time, is also key. Below is a visual representation of the drying-up observed around COVID-19: the ability to easily exit a fixed-income position, slowly tightened in the first few weeks from the beginning of the virus, and eventually dropped in correspondence of the market slump towards mid-March.click to expand
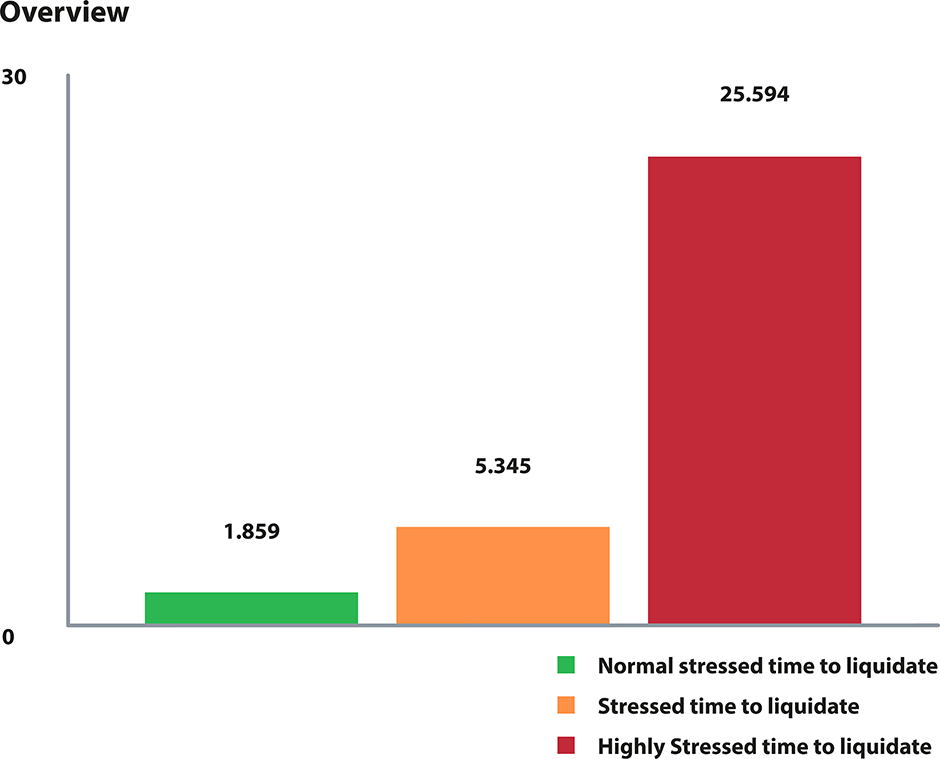
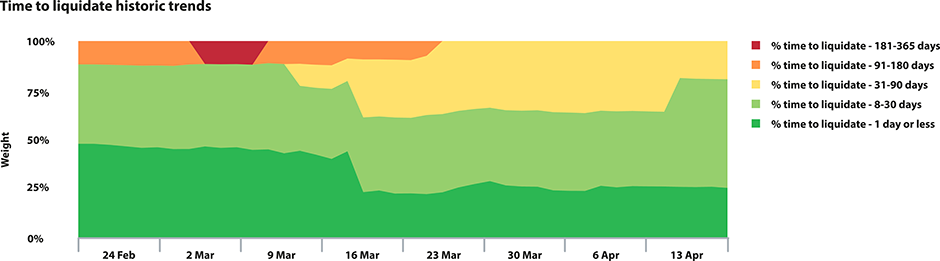
The average liquidation time increases at the increase of the turbulence in the market: especially in the presence of large equity positions and/or small bond issuances, the capacity of the markets to absorb the sudden liquidation requests decreases.
Among the various features made available, Revolution allows the additional analysis of the role played by the size of the traded volumes from both traditional trading desks and electronic trading platforms, the market capitalisation, the outstanding bond amounts and the percentage owned. Typically, the higher the market cap, the lower the cost of liquidation; however, the higher the percentage owned of the same market cap, the higher the liquidity risk associated.
Modelling shifts in expectations
In recent times, asset, risk, and compliance managers have faced more and more challenges in the monitoring of the width, the depth and the resiliency of investment funds. In fact, individual investors who sell shares of Apple or Microsoft, for example, are unlikely to impact the price. Conversely, institutional investors selling large blocks of shares of a small-cap company will probably cause the price to fall. As prices fall, the investment funds holdings these assets will face larger drops in their net asset values, finally pushing the investors to exit the investments.
As investors hunt for decent returns following almost a decade of low-interest rates, portfolio managers are therefore called to look at the liquidity of the higher-yielding assets, but the increasing fear around the current market conditions is certainly raising concern around the possible redemptions, and the fast decreasing resilience of the funds.
What happens if the investors suddenly decide to redeem their amounts? If asset managers use their cash holdings as a buffer to meet investor redemptions, typically they can deal with the redemptions without selling the funds’ underlying assets. However, if asset managers need to increase their cash holdings to face the investor redemptions, they are ultimately forced to sell more of the underlying assets.
Revolution offers its users solutions to monitor different liquidation strategies that can be put in place, while securing the liability ratio. Once the method is identified, users can define multiple different actions to be applied against single securities or groups of assets and observe the simulated impact on the portfolio in terms of risk, liquidity profile and stress tests exposure.
The table below shows different levels of NAV redemption. Intuitive traffic lights alert in presence of limited cash and/or highly liquid holdings, symptomatic of a limited coverage when called to face the potential redemption. click to expand
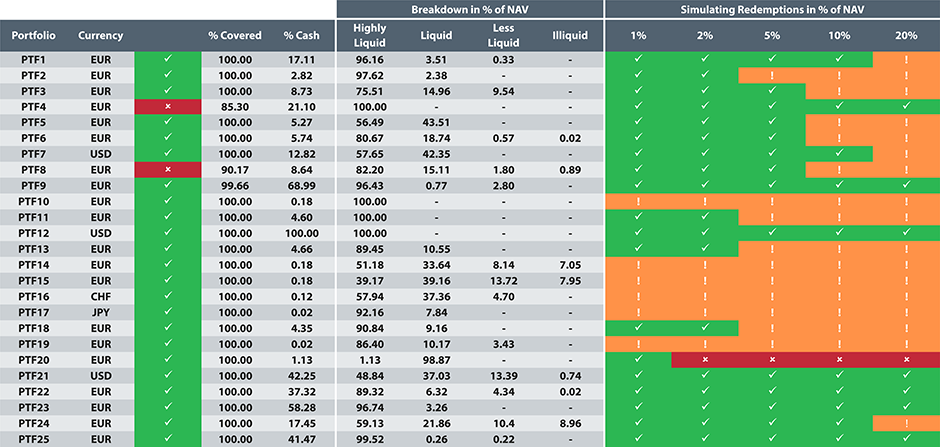
Ensuring the presence of highly liqui, liquid and illiquid investment assets should be accompanied by the ongoing monitoring of the distribution and concentration of the investors as well.
In a situation with neutral investor activity, i.e. without significant net inflows or outflows, funds usually value their assets using market mid-prices. However, in a situation where there is a significant amount of net subscriptions or redemptions, like the one we’ve been experiencing around COVID-19, switching valuation pricing to ask prices (with net inflows) or bid prices (with net outflows) would allow the incorporation into the NAV calculation of the effect of transaction costs, where the fund will be impacted when investing or disinvesting due to investor activity.
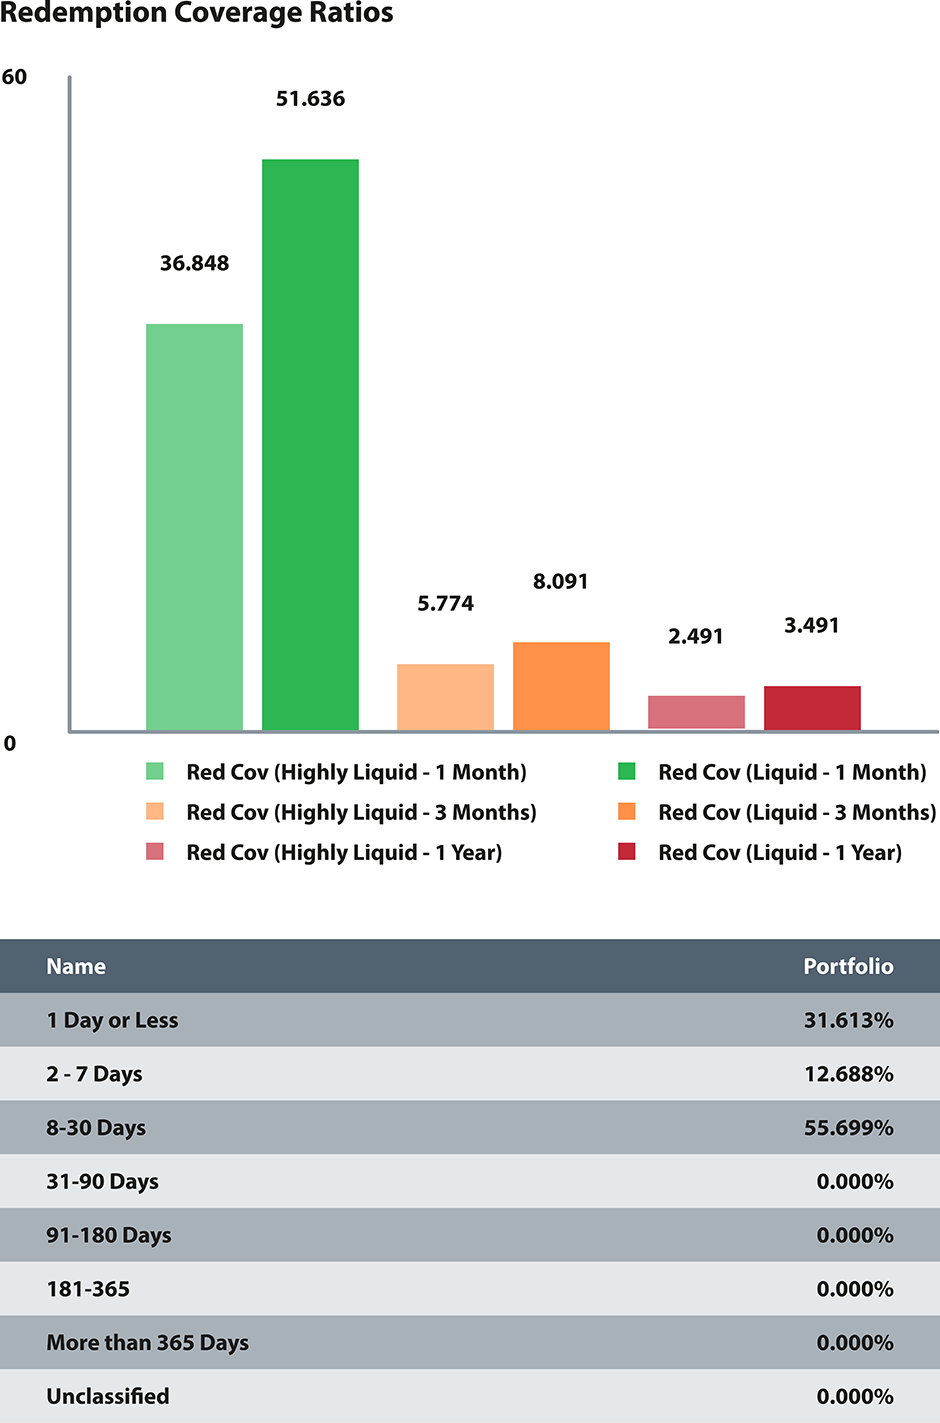
Such mismatch may constitute a serious risk to investors and the potential suspension of funds may further damage the confidence of the investors, not only in the short term but mostly in the mid- to long-term. This is why it’s important that your solution includes the monitoring of historical redemption coverage ratios and liquidity shortfall for the analysis of the resilience of the investment funds across different redemption periods.
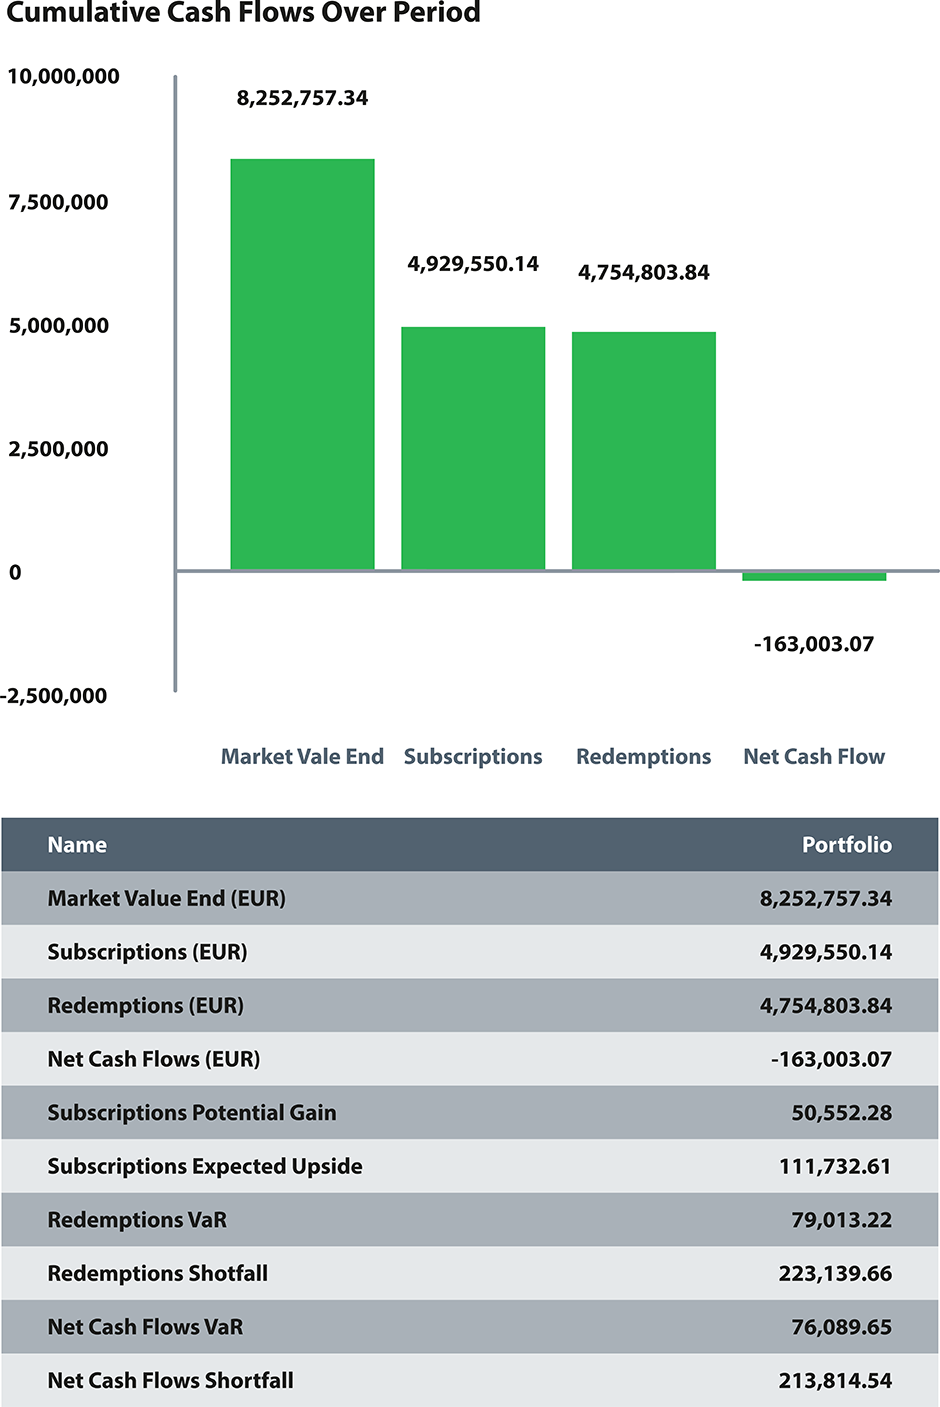
In the example below the chart shows thinner redemption coverage ratios for longer redemption periods. The net outflows cumulated over the period (163k) represents almost 2 percent of the NAV for this fund, an amount which exceeds more than twice the expected outflow that can be withstood with 99 percent of probability over one-day horizon. The expected shortfall indicates the potential buffer the fund still has prior to being severely challenged by further investors redemptions (213k). In fact, the fund still shows a redemption coverage ratio above the unit value, but this may decrease further over time, possibly under the regulatory limits.click to expand
The historical approach to redemptions has some limitations: not all funds have enough history and therefore may require proxies. Also, as it applies to fund performance, the historical outflows distribution might not reflect the future redemption risk. The forced liquidation due to investors’ redemption would have sizeable impacts, yet under normal trading conditions, the market is supposedly able to absorb the sales without disruptions for most asset classes.
As we’ve seen in the above examples, the reverse stress testing of fund levels begins identifying the point at which the fund would no longer be liquid enough to match redemption requests, but should also continue in postulating events that might cause additional stresses such as the top investors leaving – possibly differentiating among investor classes – or larger drifts from swing pricing.
Conclusion
Stressing fund liabilities to determine the effect of fund liquidity is essential, especially when additional investment restrictions apply. That is why the time for implementing the latest liquidity stress testing guidelines is now. It is of utmost importance that the fund industry starts learning from the recent COVID-19 shock and start promoting the modelling of the possible shift in market expectations and associated liquidity crunch. As ESMA chair Steven Maijoor said:“The stress simulation framework is a key element of ESMA’s stress testing strategy, which also includes guidelines on liquidity stress testing and on money market fund stress testing.
The resilience of the fund sector is of growing importance as it accounts for an increasing part of the EU financial system. […] This framework will be an important tool for supervisors to assess risks in the asset management industry, as the methodology developed by ESMA can be applied across the industry’s different sectors.”*
This is the reason we have developed a cross-functional solution that is able to respond to the evolving liquidity regulatory frameworks globally, across both assets and liabilities. Our combination of quantitative and qualitative modelling, together with scalable technology and custom reporting, makes our solution unparalleled in today’s market.
Download the revolution fact sheet to learn about a comprehensive solution for managing global liquidity risk, stress testing and reporting from a single platform.